Please note that the screenshots provided are generic. While they may not match the exact color scheme of your Research & Analytics Platform, the content and functionality are correct.
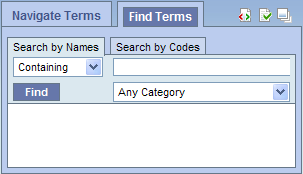
The Find Terms view is designed to allow users to search for concepts. Users can search by the name or by a particular code. Once the appropriate concept is found it can be used in many of the other views, such as the Query Tool view.
This section describes the layout and contents of this view.
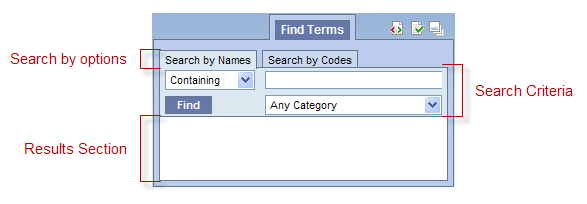
The Find Terms view allows users to search for a concept and group of concepts. There are basically two methods of searching available: (1) by name; and (2) by code.
|
NOTE: Regardless of how you search for the concept the layout of both tabs is the same. |
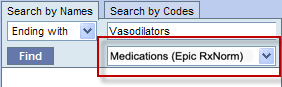
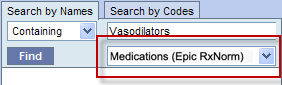
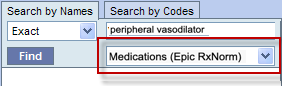
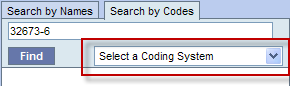
This section has two tabs; one is to Search by Name and the other Search by Code. Depending on which tab is active will determine which search method is used to find the concept.
|
NOTE: The Search by Names results will be displayed hierarchically (i.e displaying the found items within their branches and twigs accordingly). The Search by Codes results will be listed sequentially. |
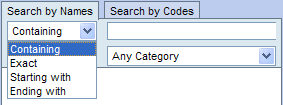
There are three fields in this section; (1) Qualifier, (2) Text and (3) Category
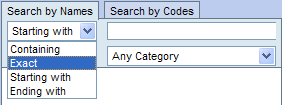
The qualifier is used to tell the system whether or not you are looking for an exact match or just a partial match. There are four different options to choose from:
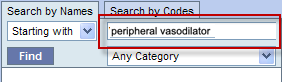
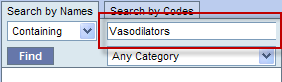
The text box is where you will enter what you are searching for.
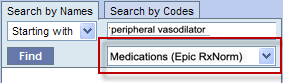
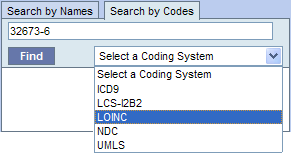
The category / coding system selection field allows you to narrow down the search to a particular table or set of codes.
The results section displays the concepts that were found based on the search criteria.
The clinical vocabulary that resides in the Ontology Management Cell was partially built using terminology from several standard coding systems. These codes can be used to search for a particular term (see section on Search by Code). The following are some examples of standard coding systems.
Example:
Code: 414.9
Description: Chronic Ischemic Heart Disease, unspecified
Example:
Code: 13969-1
Description: CPK-MB
Example:
Code: 12783-*178-87
Description: Briston-Myers Squibb, Pravachol, 20 mg tablets
Example:
Code: C0001403
Description: Addison's Disease
Depending on the search criteria, the results section may display groups of concepts which are contained in folders as well as individual concepts. The folders can be expanded to see the listing of concepts in that grouping by clicking on the plus sign ( ) or negative sign (
 ) next to the folder icon.
) next to the folder in the results section of Find Terms view.
) next to the folder in the results section of Find Terms view or the Modifier folder in the Find Modifiers section.
Users can define how many concepts to display and whether or not to show hidden terms and/or synonyms. The display options are set in the Find Terms Options dialog window, which can be accessed by clicking on the Show Options button ( ).
).
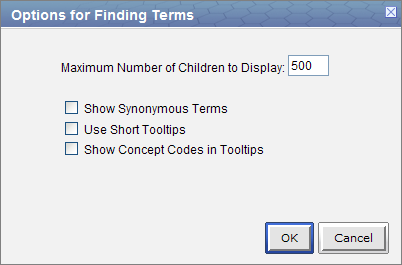
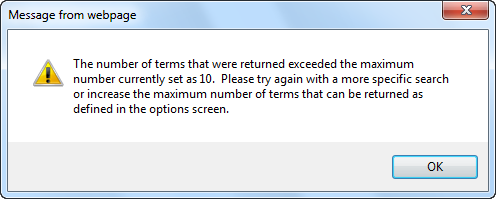
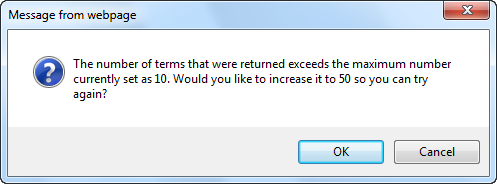
The Maximum number of children to display is used when retrieving the search results to be displayed in the results section of the Find Terms view. Once the maximum number is reached a message will appear informing you that the query has reached the maximum number of terms and suggests you try searching again with a more specific query. Running a search with a more specific query will narrow your results as the selection criteria will not be as broadly defined.
Some terms may be flagged as a synonym of another term. Selecting Show Synonymous Terms will display both the original term and the synonym in the Find Terms view. For easy identification, synonymous terms will be blue when displayed in the results list.
By default, the tooltip that displays when you hover over an item will contain the entire path name and the tooltip that is specific to that item. Enabling the Use short tooltips option will only display the tooltip information; the path will not be included.
In addition to showing the tooltip, this option will also display the concept_cd associated to the item.
This section describes how to search for a term using one of the two available methods: (1) Search by Name and (2) Search by Code.
"Search by Name" results are displayed hierarchically (i.e. a found item will be displayed alongside its containment folder tree and twig); whereas "Search by Code" results are not (i.e. all found items will be displayed by themselves, without their corresponding containment folder tree nor twig).
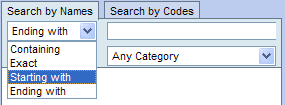
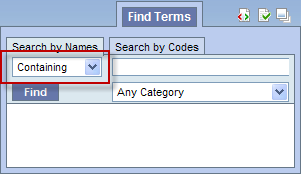
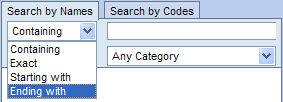
Regardless of whether you are searching by name or by code, the first step in entering the search criteria is defining a qualifier. The first field is the “qualifier” and it is a drop-down list with four options:
The results returned will contain only those terms whose name or code begins with the text entered in the search box.
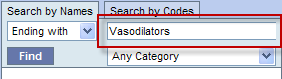
The results returned will contain only those terms whose name or code ends with the text entered in the search box.
The results returned will be those terms whose name or code ends with the text entered in the search box.
|
NOTE: This search will return the broadest range of results. |
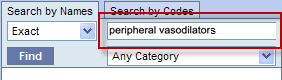
The results returned will be those terms whose name or code matches exactly to the text entered in the search box.
|
NOTE: This search will return the narrowest range of results. |
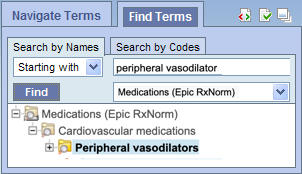
The method of searching by the name is exactly what it sounds like; you can search for a concept by its name.
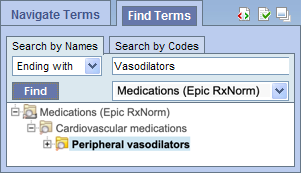
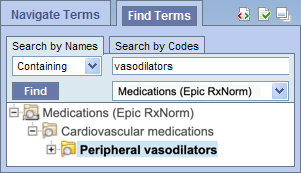
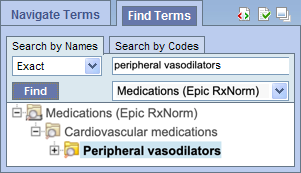
"Search by Name" results are displayed hierarchically (i.e. a found item will be displayed alongside its containment folder tree and twig).

|
NOTE: As stated previously, the "Search by Name" results are displayed hierarchically (i.e. a found item will be displayed alongside its containment folder tree and twig). In this example, the highlighted and bold found item "Peripheral vasodilators" is displayed as a leave in the "Cardiovascular medications" twig, within the "Medications (Epic RxNorm)" branch. |
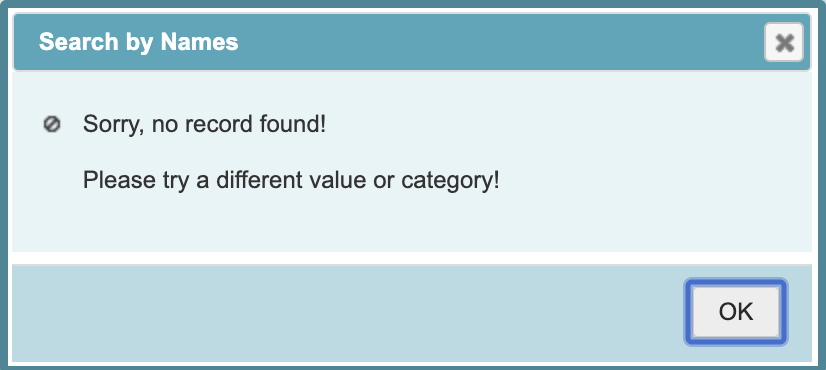
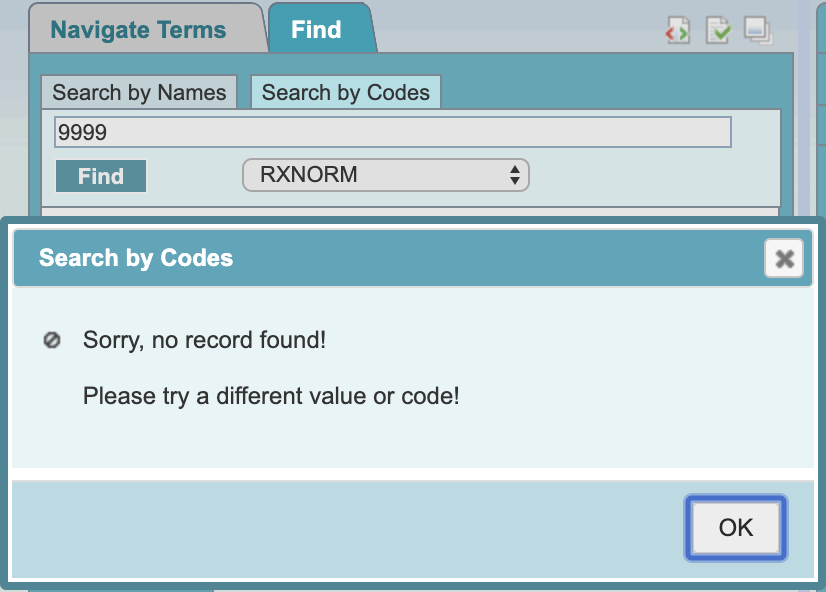
A dialog similar to the following will be displayed if the specified search does not result in any item found.
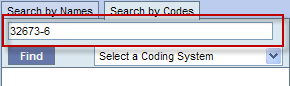
Some of the concepts have a standard code associated with them. This code can be used to search for a specific concept or a grouping of concepts.
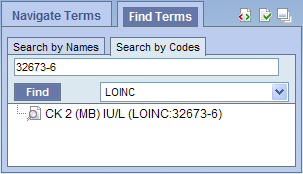
"Search by Code" results are not displayed hierarchically (i.e. all found items will be displayed by themselves, without their corresponding containment folder tree nor twig).
|
NOTE: The steps listed in this section walk you through a code search using LOINC codes. These same steps can be used when doing a search of any type of code. In step 4, replace LOINC with the coding system you want to search. |
A dialog similar to the following will be displayed if the specified search does not result in any item found.
This section describes how to use a concept or group of concepts.
Individual as well as groups of concepts can be dragged and dropped (copied) from the Find Terms View to other views in the Web Client.
A folder (![]() ) and all its concepts (children) can
be added to other views by dragging the folder name from Find Terms to one of the following views:
) and all its concepts (children) can
be added to other views by dragging the folder name from Find Terms to one of the following views:
A concept ( ) can be added to other views by dragging the name of the
concept from Find Terms to one of the following views:
) can be added to other views by dragging the name of the
concept from Find Terms to one of the following views:
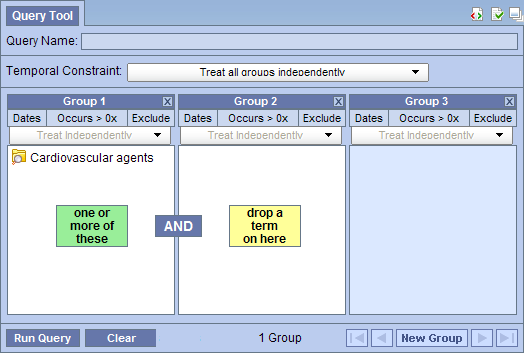
A folder, or individual concept, can be added to the query tool view by simply dragging the item from Find Terms view and dropping it into one of the panels in the Query Tool view.
Information in the workplace is related to the most common concepts and queries that an individual uses and in essence becomes their personal workplace.
) by clicking on the name of the concept.
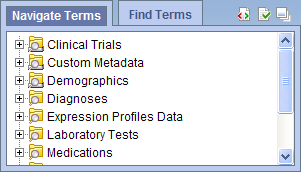
The Navigate Terms view is designed to display the vocabulary ontological concepts. These concepts are used in many of the other views, such as the Query Tool view.
This section describes the layout and contents of this view.
The Navigate Terms view displays the terms listed in the metadata table(s). These terms are grouped (categorized) with other similar items. These groupings are displayed in a hierarchal tree that can be expanded to view all the concepts and modifiers in the associated category.
As stated above, the Navigate Terms view is a hierarchical display of the concepts.
The highest level is the name of the metadata table that stores the vocabulary. This level cannot be used when creating a query.
A container (![]() ) has other folders
or concepts. It can be expanded and collapsed by clicking on the plus sign
(
) has other folders
or concepts. It can be expanded and collapsed by clicking on the plus sign
(![]() ) or minus sign (
) or minus sign (![]() ) next to it. It can not be dragged to other views.
) next to it. It can not be dragged to other views.
A folder (![]() ) contains other folders
and / or concepts. It can be expanded and collapsed by clicking on the plus sign
(
) contains other folders
and / or concepts. It can be expanded and collapsed by clicking on the plus sign
(![]() ) or minus sign (
) or minus sign (![]() ) next to it. It can also be dragged to other views.
) next to it. It can also be dragged to other views.
The concept (![]() ) is the lowest level of the hierarchy and cannot be expanded further.
) is the lowest level of the hierarchy and cannot be expanded further.
Users can expand or collapse a folder by clicking on the plus sign () or negative sign () next to the folder icon.
) next to the folder in the Navigate Terms view.
) next to the folder in the Navigate Terms view.
Users can define how many concepts to display and whether or not to show hidden terms and/or synonyms. The display options are set in the Navigate Terms Options dialog window, which can be accessed by clicking on the Show Options button ().
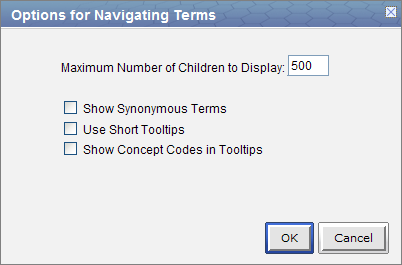
The Maximum number of children to display is used when expanding a folder in the Navigate Terms view. Once the maximum number is reached a message will appear informing you that you have reached the maximum and continuing to retrieve all the concepts in the list may affect performance. You will have the option to continue or to cancel the action.
Some terms may be flagged in the metadata table as a synonym of another term. Selecting Show Synonymous Terms will display both the original term and the synonym in the Find Terms view. For easy identification, synonymous terms will be blue when displayed in the results list.
By default, the tooltip that displays when you hover over an item will contain the entire path name and the tooltip that is specific to that item. Enabling the Use short tooltips option will only display the tooltip information; the path will not be included.
In addition to showing the tooltip, this option will also display the concept_cd associated to the item.
This section describes how to use a group of concepts or a single concept.
Individual as well as groups of concepts can be dragged and dropped (copied) from the Navigate Terms view to other views in the Web Client.
A folder (![]() ) and all its concepts (children) can be added to other views by dragging the folder name from Navigate Terms to one of the following views:
) and all its concepts (children) can be added to other views by dragging the folder name from Navigate Terms to one of the following views:
A concept (![]() ) can be added to other views by dragging the name of the concept from Navigate Terms to one of the following views:
) can be added to other views by dragging the name of the concept from Navigate Terms to one of the following views:
A folder or an individual concept can be simply dragged from Navigate Terms view and dropped into one of the panels in the Query Tool view.
Information in the workplace is related to the most common concepts and queries that an individual uses and in essence becomes one's personal workplace.
) by clicking on the name of the concept.
The Previous Query view is designed to display the most recent queries run by a user. The results associated to the query are also available for viewing.
This section describes the layout and contents of the Previous Query view.
|
NOTE: There are two types of queries that can be run in the Web Client;
Both of these types of queries will appear in the Previous Query view and throughout this document they will both be referred to as a "Previous query". For more detailed information on the distinction of these two types of queries please see the Query Tool help. |
A previous query ( /
/  ) is created when a query is run from the Query Tool.
The query is stored and displayed in the Previous Query view. These previous queries can be used to run new queries or to easily populate other views.
) is created when a query is run from the Query Tool.
The query is stored and displayed in the Previous Query view. These previous queries can be used to run new queries or to easily populate other views.
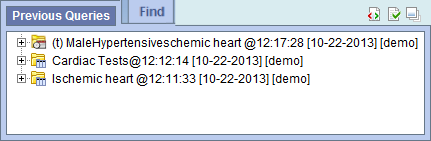
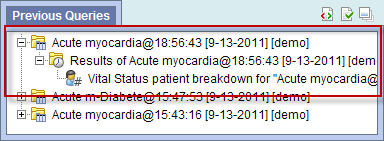
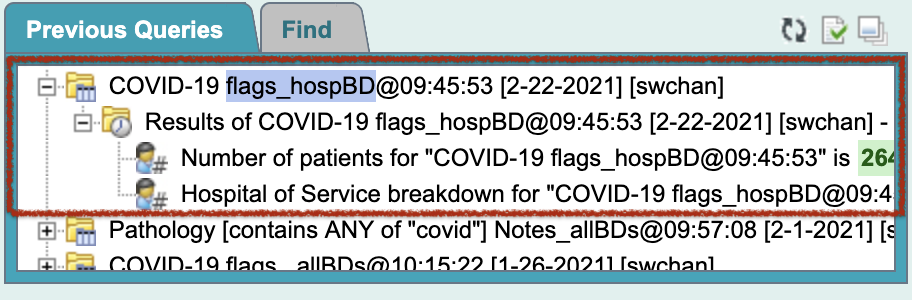
The query in the previous query view is comprised of multiple hierarchical levels that can be seen by expanding each level of the tree. These levels are outlined below.
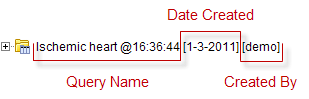
The name of the previous query is the top level of the hierarchal tree and is comprised of these three components.
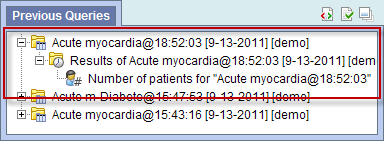
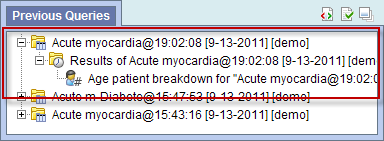
The Results folder (![]() ) contains the results of the query. To see the query results simply expand the folder by clicking on the plus sign () located next to the result name.
) contains the results of the query. To see the query results simply expand the folder by clicking on the plus sign () located next to the result name.
The results associated with a previous query are determined by the query result type(s) that are selected when the query is run in the Query Tool view.
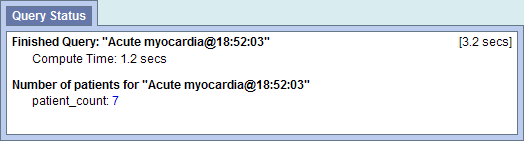
The Number of Patients ( ) appears if Number of Patients was checked at the time the query was run. The results are a total count for those patients who met the defined criteria.
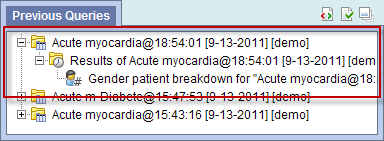
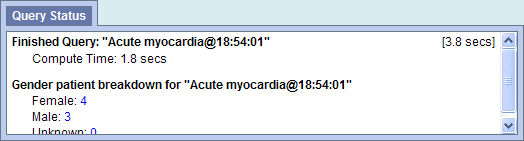
The Gender patient breakdown ( ) appears if Gender patient breakdown was checked at the time the query was run. The results are a breakdown by gender for those patient who met the defined criteria.
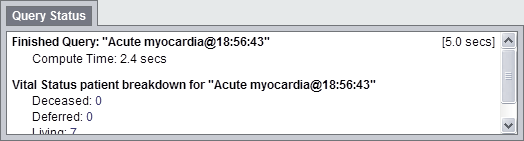
The Vital Status patient breakdown () appears if Vital Status patient breakdown was checked at the time the query was run. The results are a breakdown by vital status for those patient who met the defined criteria.
The Race patient breakdown () appears if Race patient breakdown was checked at the time the query was run. The results are a breakdown by race for those patient who met the defined criteria.

The Age patient breakdown () appears if Age patient breakdown was checked at the time the query was run. The results are a breakdown by age for those patient who met the defined criteria.
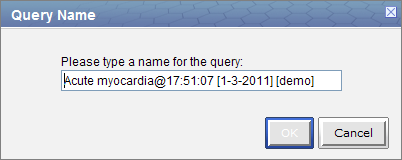
Users can rename a previous query from the list by selecting Rename from the popup menu.


|
NOTE: When dragging a previous query to another view the new name will appear when it is dropped. |
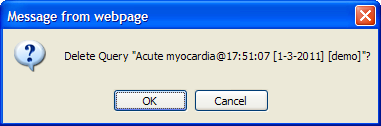
Users can rename a previous query from the list by selecting Delete from the pop-up menu.

|
WARNING: Once you click on Delete, the previous query will be removed from the view and there is no way to restore it. Therefore you need to make sure you want to remove it from the list. |
Users can refresh the list of previous queries from the list by selecting Refresh All from the pop-up menu.
Users can define how many previous queries to display and the order in which they will appear in the list. The display options are set in the Options for Previous Queries window, which can be accessed by clicking on the Show Options button ().
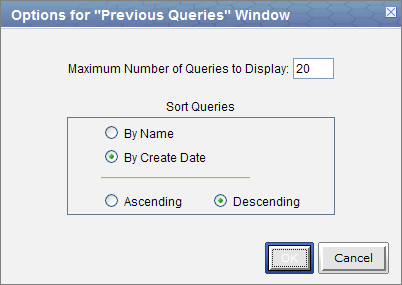
The Maximum number of queries to display defines how many previous queries will be visible in the Previous Query view. Once the maximum number is reached the oldest query will no longer appear in the view.
|
TIP: Recommendation: Use the Workplace view to save those previous queries that will be used often. In addition to being more convenient it will also prevent you from loosing a common query if the maximum number to display has been reached. |
Selecting to sort By Create Date will sort the queries in the Previous Query view by the date and time the query was created. Once you select to sort by the creation date, you need to define whether or not it will be in ascending or descending order.
Ascending: displays the oldest query first.
Descending: displays the newest query first.
|
NOTE: Renaming a query will not affect the sort order as the date and time is stored with the previous query. |
Selecting to sort By Query Name will sort the queries in the Previous Query view alphabetically by the name of the query. Once you select to sort by name, you need to define whether or not it will be in ascending or descending order.
Ascending: queries are displayed in alphabetical order with the beginning of the alphabet at the beginning of the list. (A to Z)
Descending: queries are displayed in alphabetical order with the beginning of the alphabet at the end of the list. (Z to A)
This section describes how to use a previous query.
Any previous query can be dragged and dropped (copied) from the Previous Query view to other views in the Web Client.
Associated with each previous query ( / ) are the items used to run the query, any constraints that were defined, and the results. A previous query can be added to other views by dragging the previous query name from Previous Query view to one of the following views:
The Query Tool view is designed to simplify the process of retrieving information from the database associated to the Web Client.
Within the Previous Query view there are several items that can be used in the Query Tool view to run a query. The following sections explain how to add the previous query and patient set to the Query Tool view.
Within the Query Tool view, a previous query can be copied to one of the following two locations.
| Query Name field | The items and constraints from the original query will be used to create a new query. This information can be edited to make a new query or can be used as is to run the query again. |
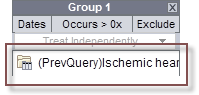
| Panel (Group) | Used within a new query (query-in-query). The information associated with the previous query can not be edited. Add additional search criteria (items) to be used in the new query. |
/ ) by clicking on the name of the query.
|
NOTE: When you run the query it will receive a new name. This is to distinguish the first previous query from the second. |
/ ) by clicking on the name of the query.

Information in the workplace is related to the most common concepts and queries that an individual uses and in essence becomes their personal workplace.
/ ) by clicking on the name of the query.
The Query Tool view is designed to simplify the process of retrieving information from the database associated to the Web Client.
This section describes the layout and contents of this view.
The Query Tool view is used to define and run a "select query" that will retrieve information from the database associated to the Web Client.
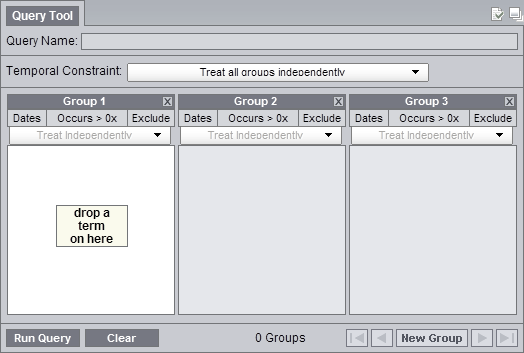
The Query Tool view can be broken down into several sections which are defined below.
The name of a query will be assigned when it is run and will display in the Query Name field.
![]()
The only time a query name will appear prior to running the query is when you drag a previous query from either the Previous Query or Workplace views and drop it into the Query Name field.
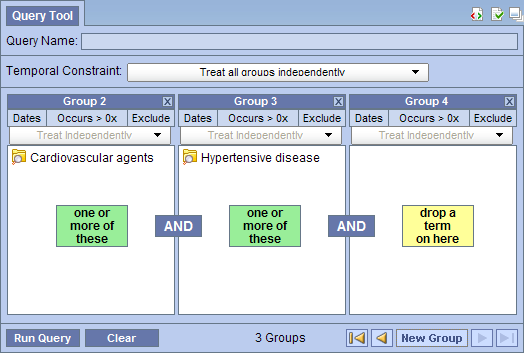
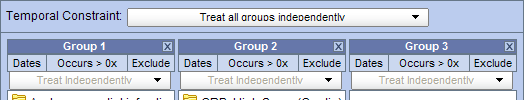
The Temporal Constraint is defined on the query level and depending on what is selected will set the default for the panel timing.
![]()
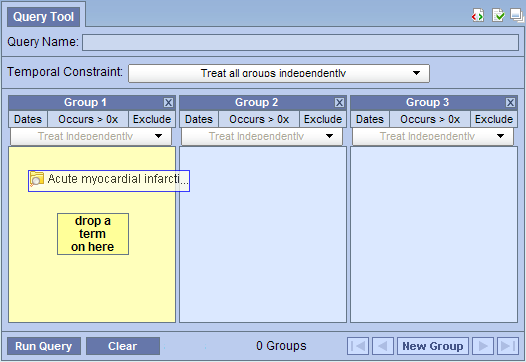
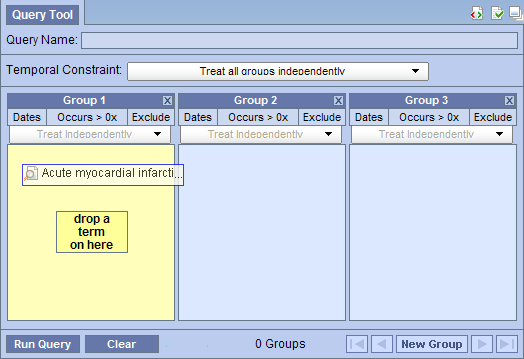
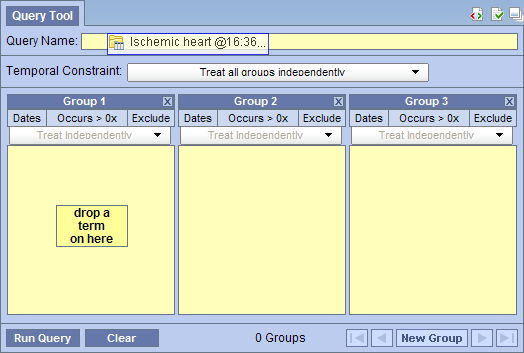
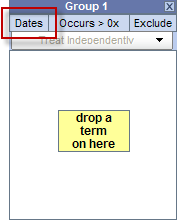
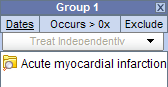
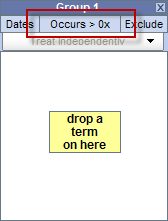
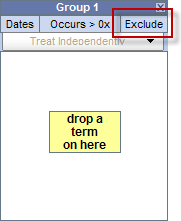
A panel is the section of the Query Tool view that contains information about a group of concepts. The panel can be broken down into the following sections.
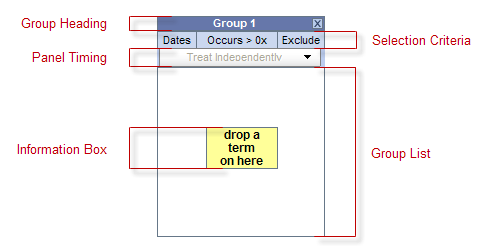
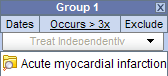
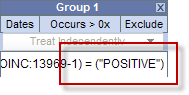
The heading is a label to easily identify the collection of terms. Each heading will contain "Group" followed by a sequential number.
Example: Group 1, Group 2, Group 3, etc.
This area of the panel is used to define date selections and other constraints.
The panel timing defines the constraint on the panel level and uses the patient's visits in determining eligibility.
This section contains the terms that will be used during the process of querying the database.
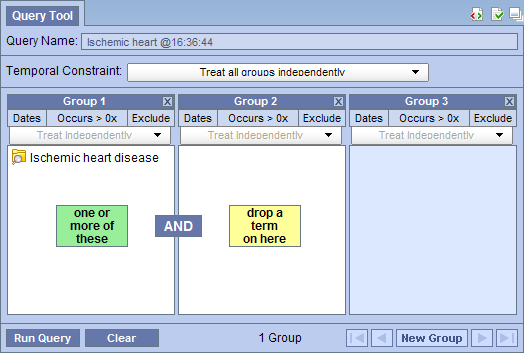
The content in the information box will change depending on whether or not a term is listed in the panel / group.
|
NOTE: Once you add an item to a panel, an additional information box will appear between the two panels containing the text "AND". This is to indicate that each panel will be joined with an AND operator when the SQL query is created. |
The toolbar is the bottom section of the Query Tool view and contains several buttons that perform various actions.
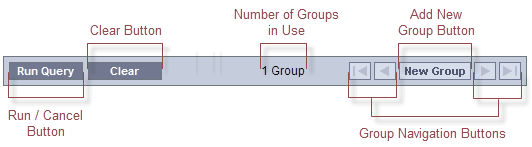
On the toolbar for the Query Tool there is a single button for running and canceling a query. Depending on the circumstances defined below the label on this button and its associated action will change to one of the following: (1) Run Query or (2) Cancel Query.
Clicking on the button labeled Run Query will run your query with the defined search criteria.
![]()
Once you start running a query, the label will change to Cancel Query. Clicking on the button when it says Cancel Query will cancel the query and free up the Query Tool / Web client so that you can continue to do other things.
|
NOTE: Clicking on Cancel Query in the Query Tool will only cancel the web client piece of the process. The server side will continue to run. |
![]()
The Clear button will reset the view to the default; this includes deleting the concepts listed in the panel and removing any constraint that have been defined.
![]()
The Query Status view is located below the Query Tool view and contains information regarding the status of a query that is either running or has just finished, as well as the results of a previous query.
There are three tabs in this panel: 'Show Query Status', 'Graph Results', and 'Query Report'.
To expand the "Query Status panel" for any of the three tabs, click on the square widget in the upper right corner of the panel.
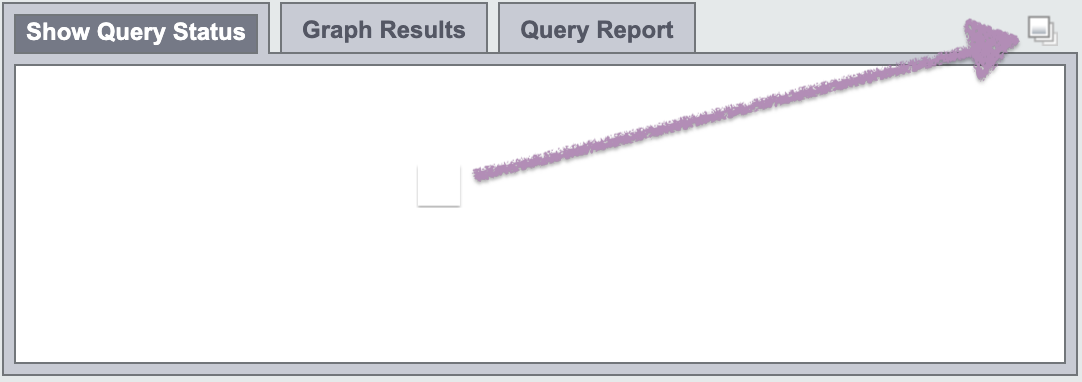
While a query is running, the name of the query and how long it has been running will appear in the 'Show Query Status' tab.
Other information that may be displayed in this tab depends on which options have been selected in the 'Run Query' popup box when the query was run.
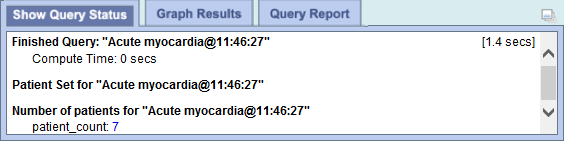
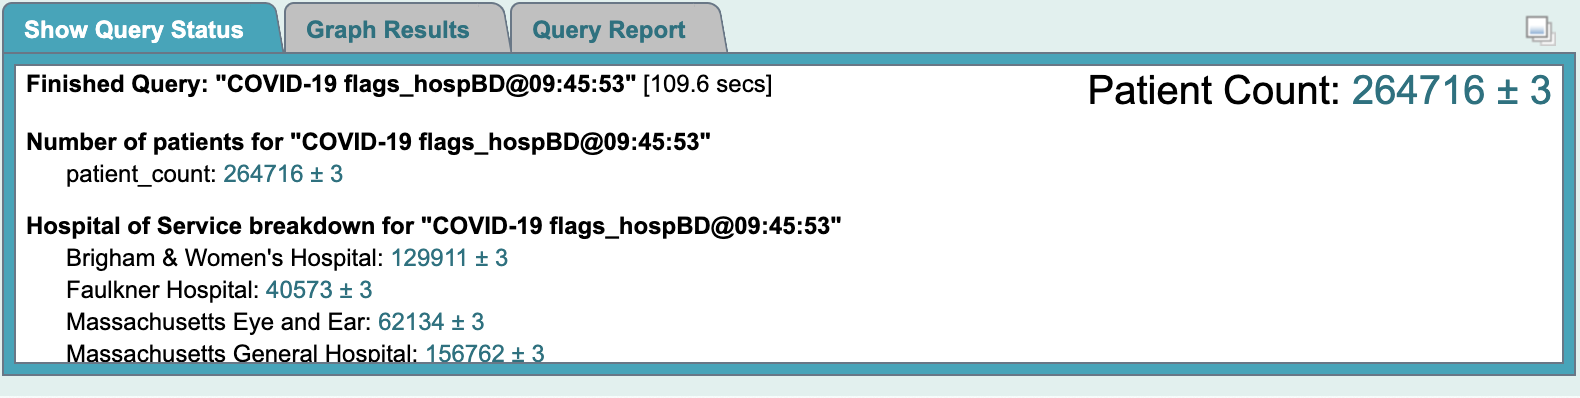
Once the query has finished, the number of patients and other data meeting the search criteria, as well as the time it took to retrieve the requested information, will be displayed.
|
NOTE: The result types that appear will depend on what you have selected when running the query.. |
The Graph Results view is located in the same panel as the Show Query Status view; i. e., below the Query Tool view. It can be displayed when the 'Graph Results' tab is selected. It contains graphical presentations of the results of a finished query.
Indeed, when a query completes, or when a previous query is rendered, the "Query Status panel" display will be automatically switched to the that of the 'Graph Results' tab presentation.
Again, there are three tabs in this panel: 'Show Query Status', 'Graph Results', and 'Query Report'.
To expand the "Query Status panel" for any of the three tabs, click on the square widget in the upper right corner of the panel.
The contents displayed depend on what options are selected in the 'Run Query' popup box when the query is run.
If any of the demographics breakdown (Age, Race, Gender, Vital Status) and hospital breakdown categories is selected in the 'Run Query' popup, corresponding charts will be display accordingly.
Following is an example of query not ran with any breakdown selected:
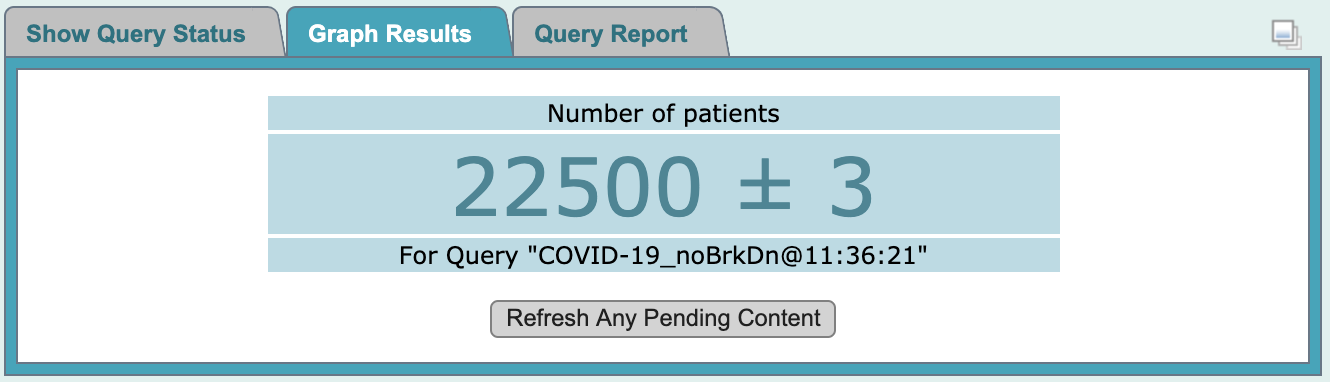
Following is an example of the same query ran with 'Hospital of Service Breakdown' selected only:
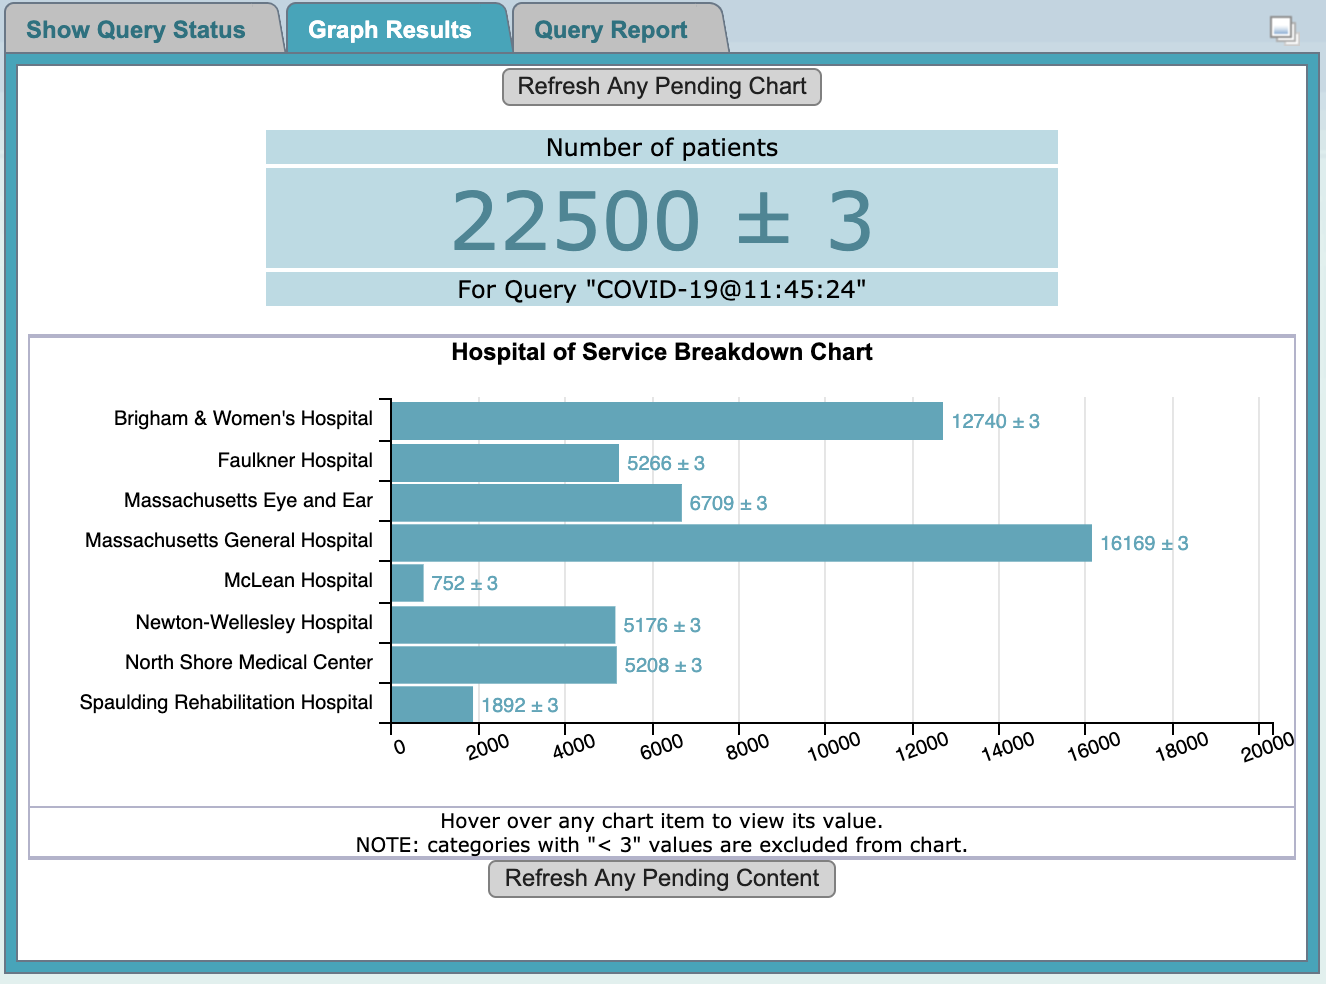
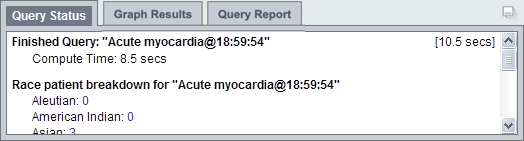
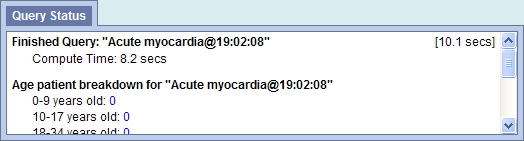
Following is an example of the same query ran with 'Patient Demographics Breakdown' selected only:
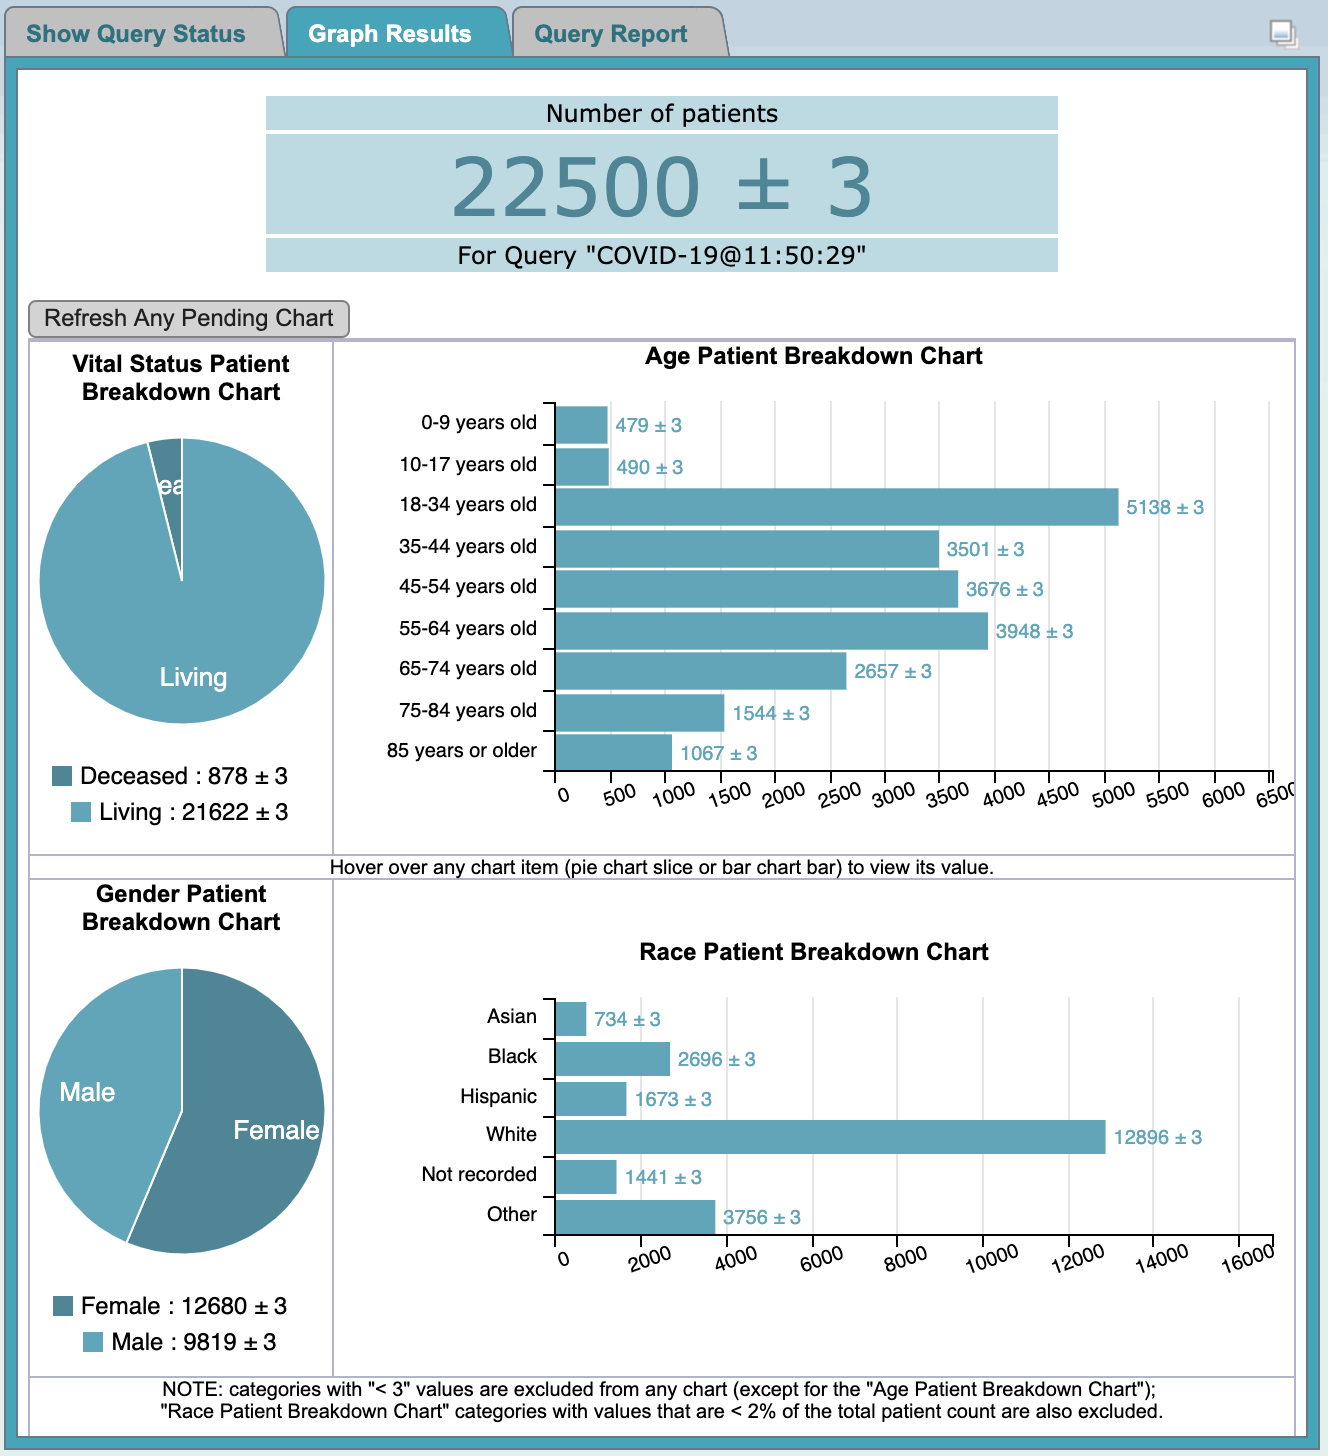
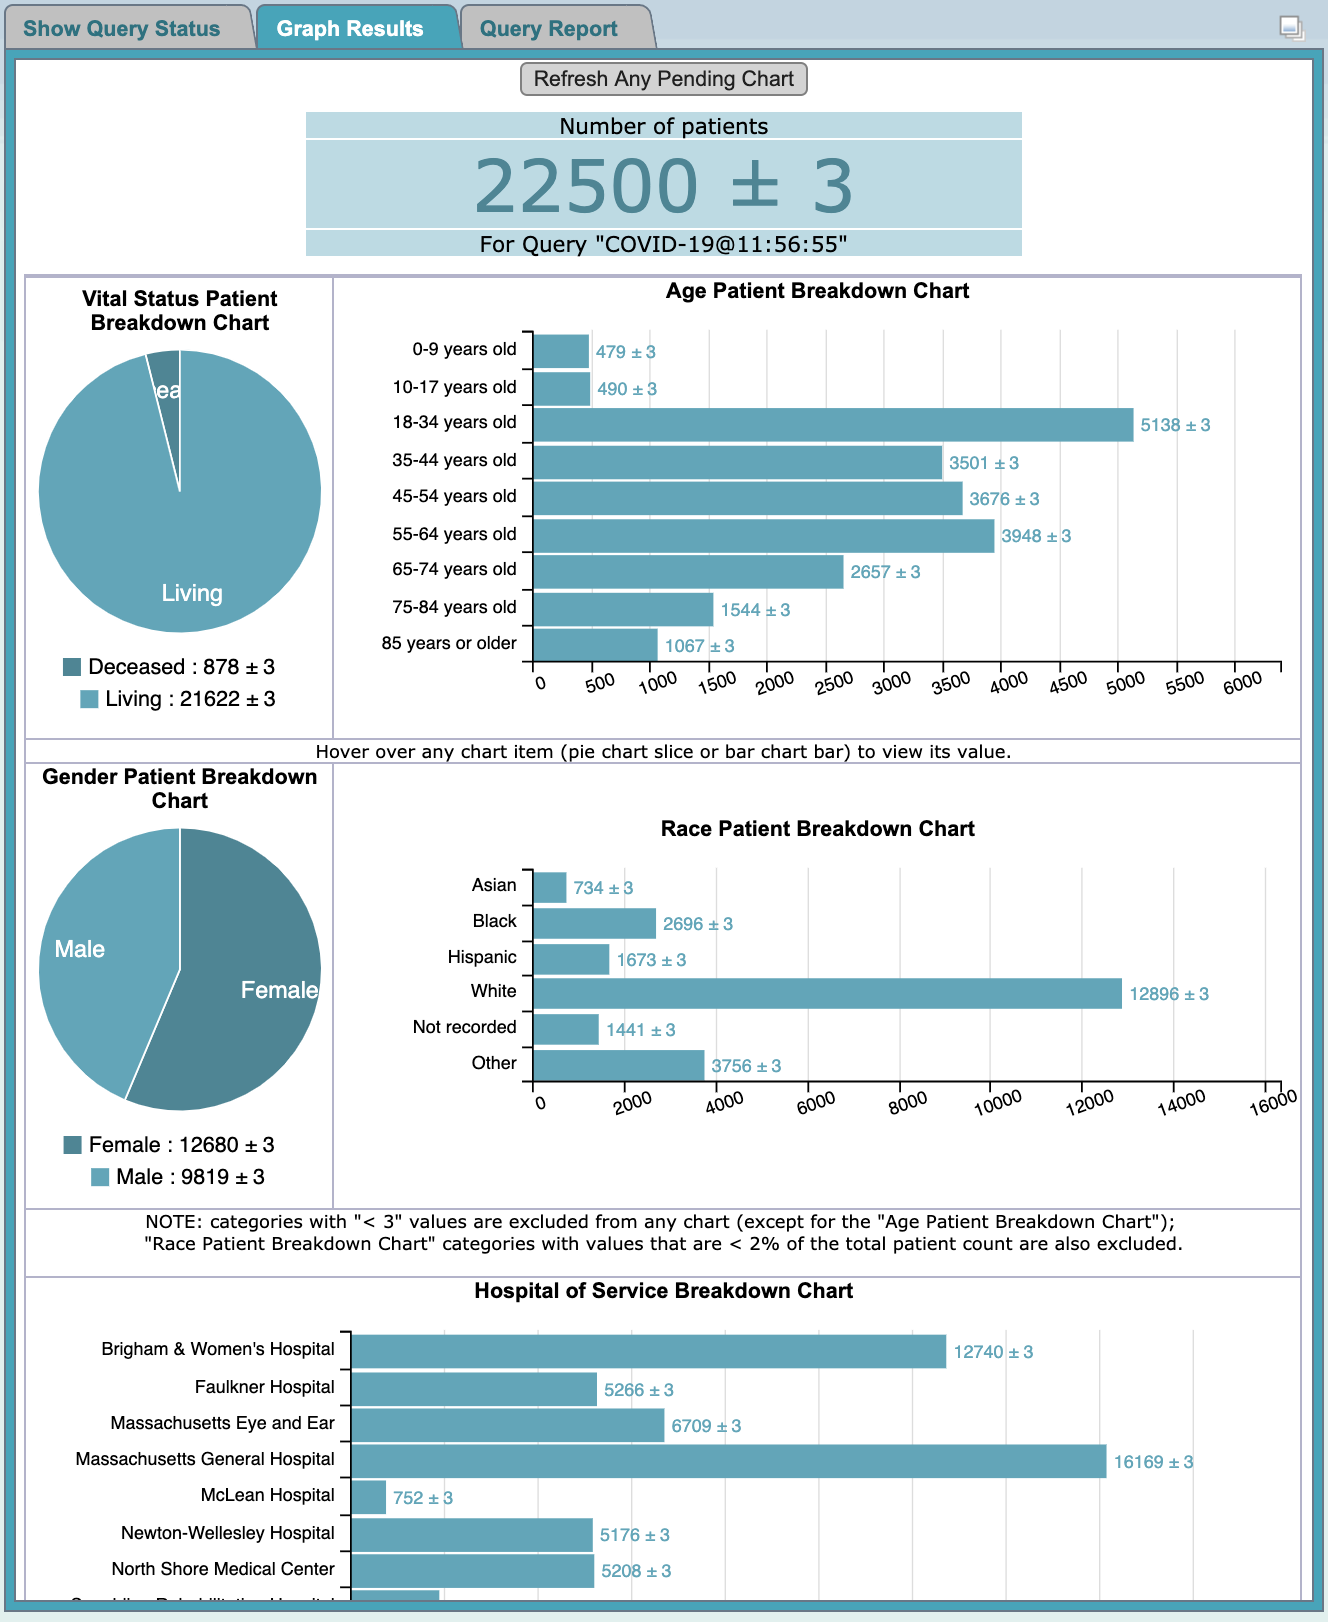
Following is an example of the same query ran with all breakdowns selected:
|
NOTE: The result types that appear will depend on what you have selected when running the query.
When the resulting collection of patients is large, and breakdown data are involved, sometimes data for one of the charts may lag behind a bit.
In such cases, simple click the |
The Query Report view is located in the same panel as the Show Query Status view; i. e., below the Query Tool view. It can be displayed when the 'Query Report' tab is selected. It contains tabulational and graphical presentations of the results of a finished query.
Again, there are three tabs in this panel: 'Show Query Status', 'Graph Results', and 'Query Report'.
To expand the "Query Status panel" for any of the three tabs, click on the square widget in the upper right corner of the panel.
The contents displayed depend on what options are selected in the 'Run Query' popup box when the query is run.
If any of the demographics breakdown (Age, Race, Gender, Vital Status) and hospital breakdown categories is selected in the 'Run Query' popup, corresponding charts will be display accordingly.
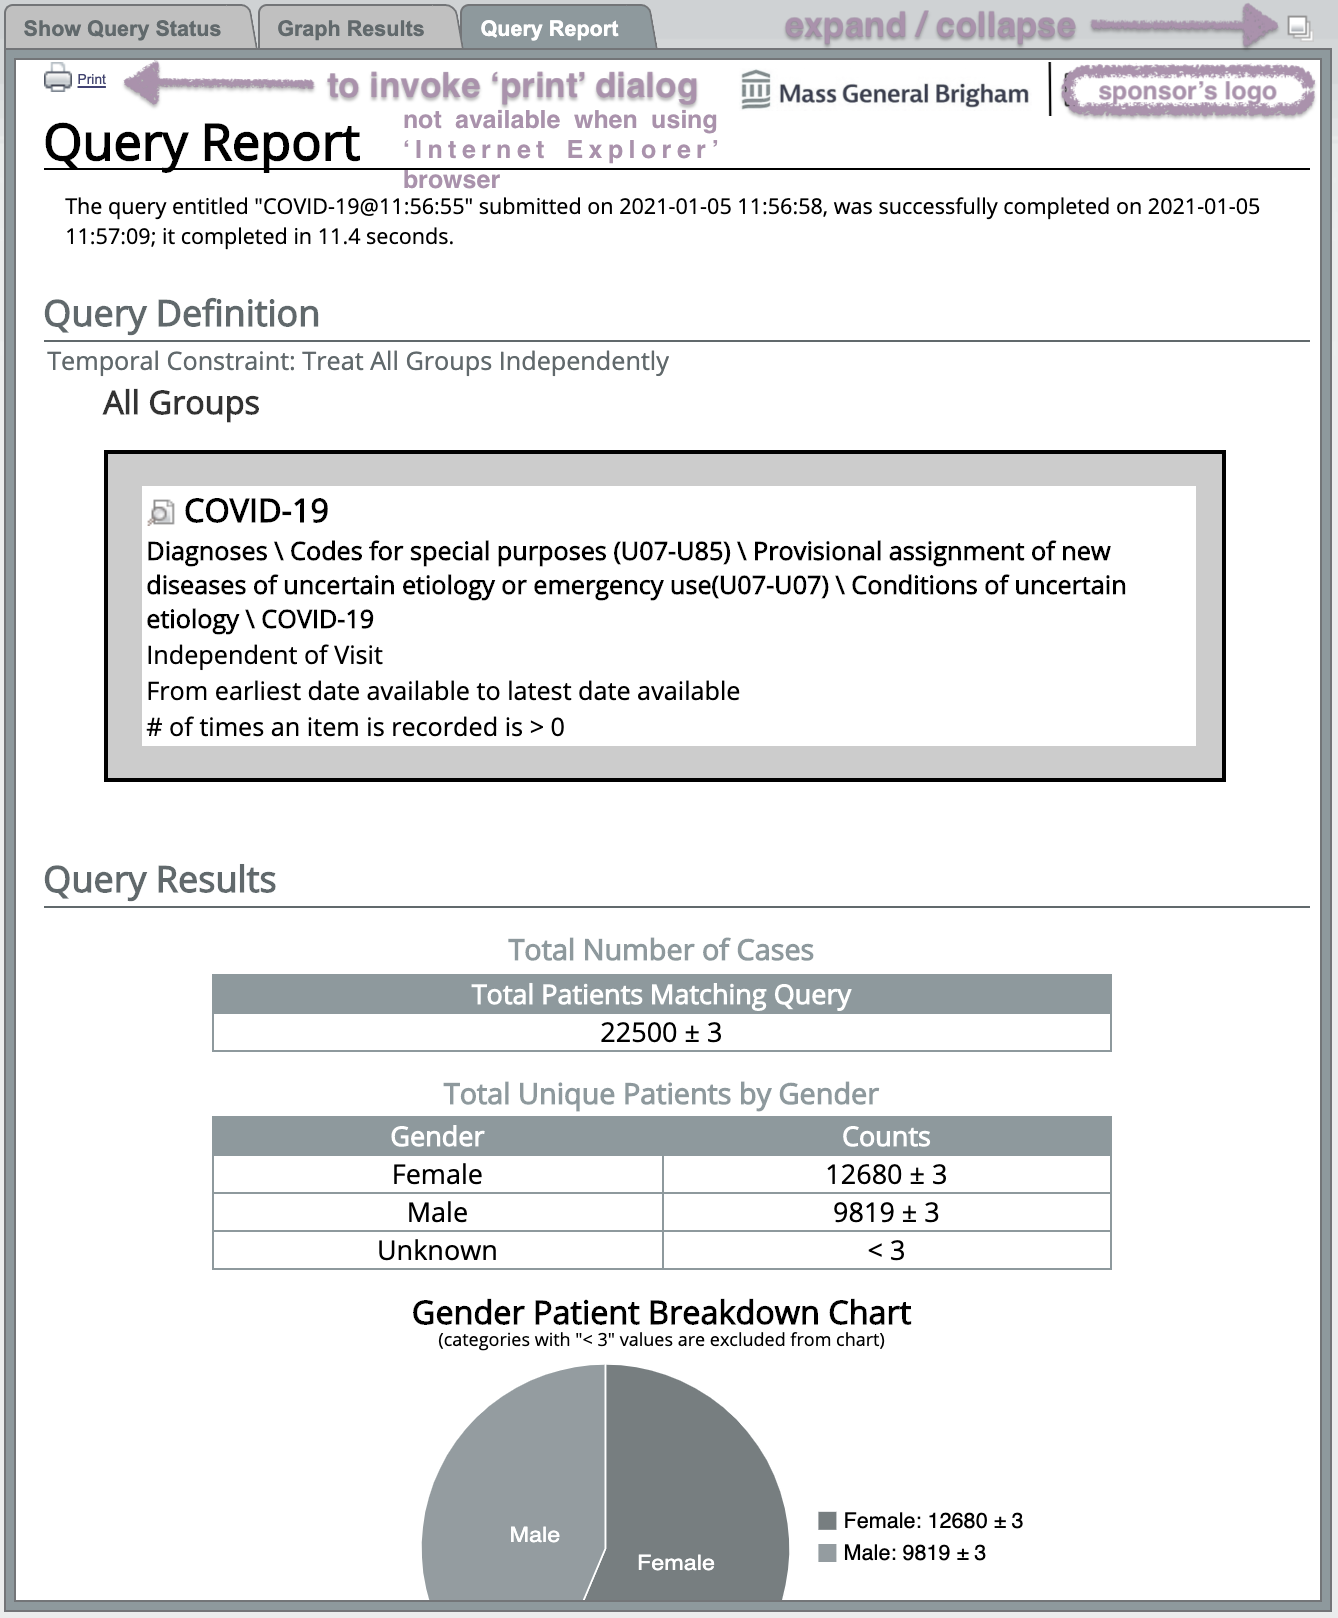
Following is an example of a query report for a query ran with all breakdown selected:
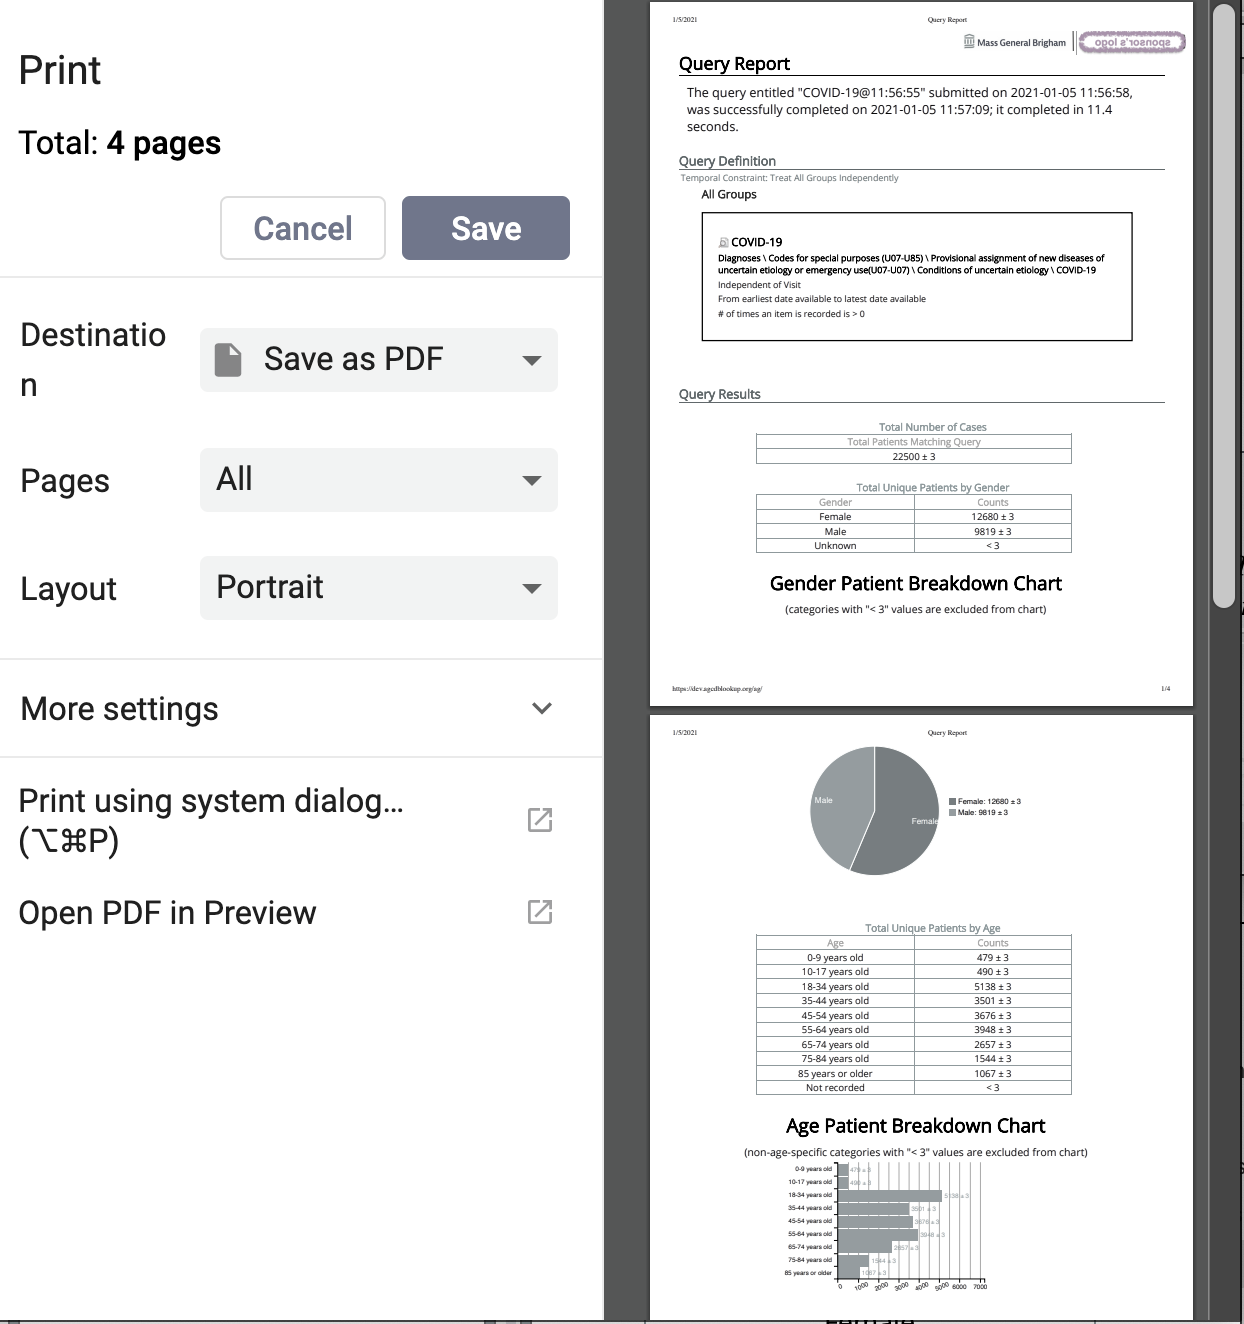
Following is an example of the resulting browser-based print dialog (using the 'Chrome' browser) when one of the 2 'Print' icons (located at the left top and bottom corners, respectively) of the query report is clicked:
|
NOTE: There is no 'Print' icon provided in the 'Graph Report' when using the 'Internet Explorer' browser, due to issues associated with that browser type. The 'Print' icons are only present in the 'Graph Report' when using the 'Firefox' or 'Chrome' browser types. |
Users can define how long to wait before a query will time out. This setting is defined in the Query Tool Options, which can be accessed by clicking on the Show Options button ().
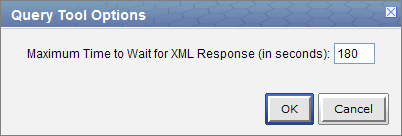
The default setting is 180 seconds, which means the web client will wait for a response from the server for 180 seconds. Once it reaches that time it will display a message saying the query has timed out and will continue to run in the background.
|
NOTE: The query timeout period must be a plain positive whole number between 20 and 240 (in seconds). |
This section describes the process of adding items to the query tool, "AND" / "OR" operators and setting constraints.
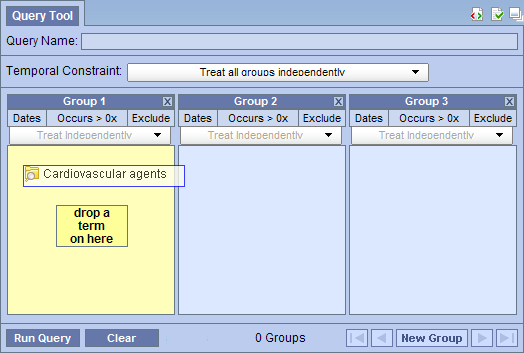
In order to create your query, you will need to define what information will be retrieved from the databases. Selected items from other Web Client views can be drag-and-dropped (copied) into the Query Tool view.
Concepts () can be defined as terms, results, providers, etc. They can be added as a group (folder ( )) or individually by dragging the item(s) from Navigate Terms, Find Terms, and Workplace views.
A new query can be created from one that has already been run by dragging the previous query ( ) from Previous Query and Workplace views.
There are two operators, known as SQL Logical Operators, which are necessary when running a query that has more than one item. These operators provide a way to specify exactly what you want to retrieve. The operators are the 'AND' and 'OR' operators.
|
IMPORTANT: The query tool knows which operator to use based on the panels used when defining the query. It is important to verify you are setting up your query correctly as each operator will return different results. |
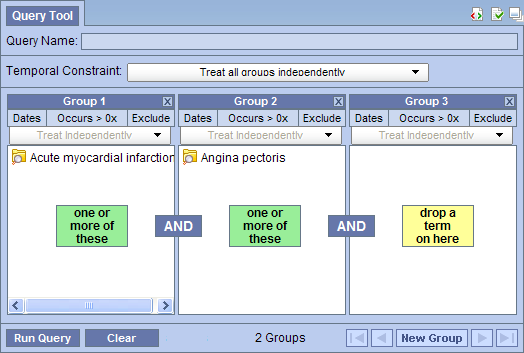
The AND operator returns a record if both the first condition and the second conditions are true.
The query tool uses the AND operator when concepts are listed in different panels.
Example:
WHAT: Return only those patients who have Acute Myocardial Infarction AND Angina Pectoris.
HOW: In the query tool add the concept Acute Myocardial Infarction to Group 1 and then add the concept Angina Pectoris to Group 2.
RESULT: The population is limited by requiring the patients fulfill both requirements.
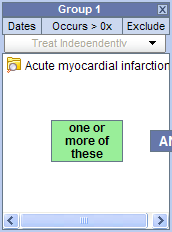
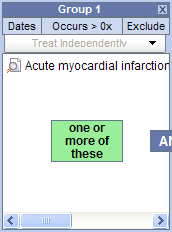
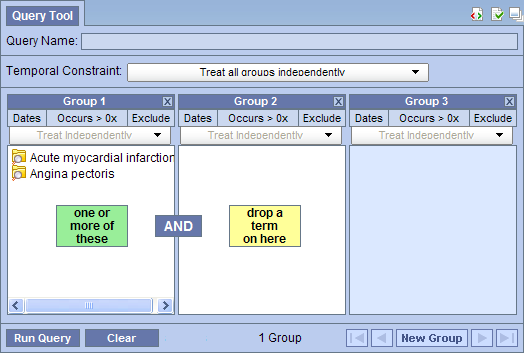
The OR operator returns a record if either the first condition or the second conditions are true.
The query tool uses the OR operator when concepts are listed in different panels.
Example:
WHAT: Return only those patients who have Acute Myocardial Infarction OR Angina Pectoris.
HOW: In the query tool add both concepts Acute Myocardial Infarction and Angina Pectoris to Group 1.
RESULT: The population is broadened to include all patients who fit either one of those criteria.
Concepts can be added to the Query Tool view by simply dragging the concept from one of the following views.
How to add a concept from each of these views is explained in the next few sections.
The Navigate Terms view contains a hierarchical display of all the items that can be used to search the database.
|
NOTE: How the items are grouped and displayed is dependent on how the database is setup. |
) or folder () by clicking on its name.
The Find Terms view provides a way to search for a particular concept.
|
NOTE: For detailed information on how to search for terms, please see the Find Terms help. |
) or folder () by clicking on its name.
The workplace allows a user to save (by drag-and-dropping them in) and reuse the most common concepts and queries, for oneself or share with other users.
) or folder () by clicking on its name.
A previous query can be used to run a new query or as an item within a query (query-in-query). To add a previous query to the Query Tool view simply drag the query name from one of the following views.
Within the Query Tool view, the previous query can be added to one of the following two locations.
| Query Name field | The items and constraints from the original query will be used to create a new query. This information can be edited to make a new query or can be used as is to run the query again. |
| Panel (Group) | Used within a new query (query-in-query). The information associated with the previous query can not be edited. Add additional search criteria (items) to be used in the new query. |
How to add a previous query from each of the views listed above is explained in the next few sections.
The Previous Query view displays the queries that were run by the user.
) by clicking on its name.
|
NOTE: When you run the query it will receive a new name. This is to distinguish the first previous query from the second. |
) by clicking on its name.
The workplace allows a user to save (by drag-and-dropping them in) and reuse the most common concepts and queries, for oneself or share with other users.
) by clicking on its name.
|
NOTE: When you run the query it will receive a new name. This is to distinguish the first previous query from the second. |
) by clicking on its name.
|
NOTE: When you run the query it will receive a new name. This is to distinguish the first previous query from the second. |
Three panels are typically displayed as part of the standard Query Tool view. Some complex queries may require the use of additional panels.
|
NOTE: In order to add a panel, the previous panels must contain at least one concept. |
![]()
On the toolbar at the bottom of the view, there are additional navigational buttons that will become active when more than three panels are being used.
| Begin button | will move the display to show the first panel | |
| End button | will move the display to show the last panel in use | |
| Previous button | will move the display back one panel | |
| Next button | will move the display forward one panel |
There are three options for removing a concept from the Query Tool view. Users can (1) reset all the groups, (2) clear all items in a panel, or (3) delete an individual item from the group.
![]()
|
WARNING: Once you click on the clear button, all items in every group; and the constraints will be removed, therefore you need to make sure you want to delete ALL items. |
 ) located in the top right corner of the panel (next to the Group name).
|
WARNING: Once you click on the delete button, all items in every group; and the constraints will be removed, therefore you need to make sure you want to delete ALL items. |
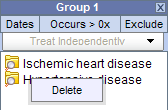
|
WARNING: Once you click on the delete, any constraints specific to that item will be removed, therefore you need to make sure you want to delete that item. |
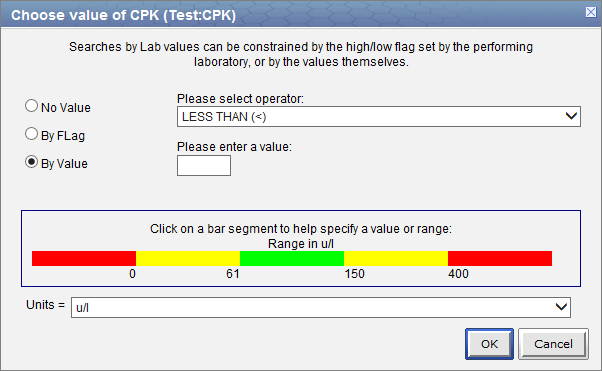
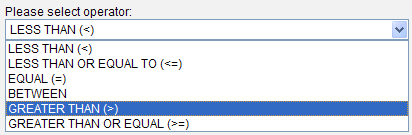
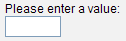
Constraints are used to narrow down the search criteria to a particular time frame, number of occurrences or a specific value or range of values. There are several types of constraints that can be defined in the Query Tool view.
| Constraint Type | Description |
|---|---|
| Temporal | Constraint is defined on the query level and utilizes the patient encounters and / or instance number when determining eligibility. |
| Panel Timing | Constraint is defined on the panel level and utilizes the patient encounters and / or instance number when determining eligibility. |
| Date | Constraint uses a date range when determining eligibility. |
| Occurrence | Constraint is by the number of occurrences an item is documented. |
| Exclusion | Constraint will not include patients with the concepts listed in the panel. |
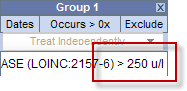
| Value | Constraint is by the value associated to a concept. Not all items have values. |
|
NOTE: In the client, the value constraints are currently the only ones that directly correspond to a single concept. All others are defined on the query or panel level. |
Both temporal and panel constraints are very similar in that both utilize the visit / encounter information along with the concepts defined to determine if a patient meets the search criteria.
The main difference between a temporal and a panel timing constraint is that temporal constraints are defined at the query level and panel timing constraints are defined at the panel level.
As stated in the previous section the Temporal Constraint is defined at the query level.
![]()
Users can select one of the following available options:
Example:
Patient has a medication with a dose greater than 500 mg and a medication that is taken once a day documented at any time in their history.
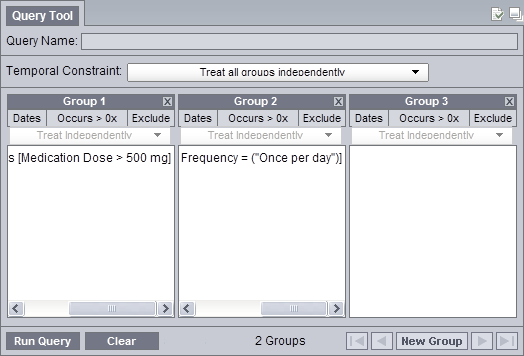
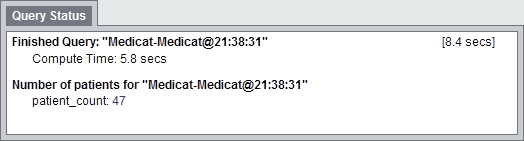
RESULTS: there are 47 patients who have had a medication with a dose of 500 mg and a frequency of once a day entered as a fact in the observation_fact table, where medication dose and frequency have the same patient_num.
|
IMPORTANT: The panel timing will override the temporal constraint setting. |
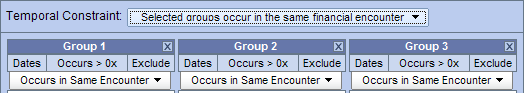
Example:
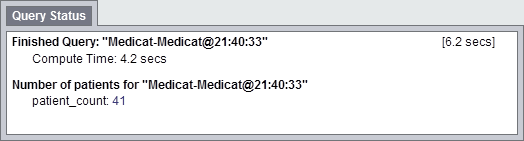
Patient has a medication with a dose greater than 500 mg and a medication that is taken once a day documented during the same visit.
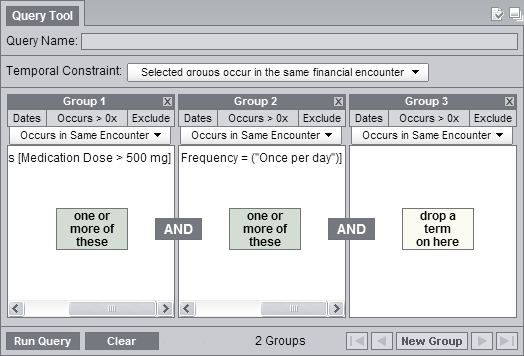
RESULTS: there are 41 patients who have had a medication with a dose of 500 mg and a frequency of once a day entered as a fact in the observation_fact table, where the medication dose and frequency have the same encounter_num.
As stated in the previous section the Panel Timing Constraint is defined at the panel level and can only be changed when the temporal constraint is defined as Selected groups occur in the same financial encounter or Items instance will be the same.
Users can select one of the following available options:
The items (facts) listed in the panel can occur at any time in the patient's history.
The items (facts) listed in the panel occur during same visit (financial encounter).
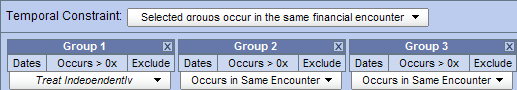
In the example shown below, the items (facts) listed in the panel for Group 1 can occur at any time in the patient's history while the items in Group 2 and 3 have to occur during the same visit.
Example:
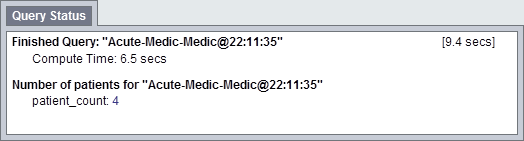
Patient has a diagnosis of Acute MI documented at any time in their history and they have a medication with a dose greater than 500 mg and a medication that is taken once a day documented during the same visit.
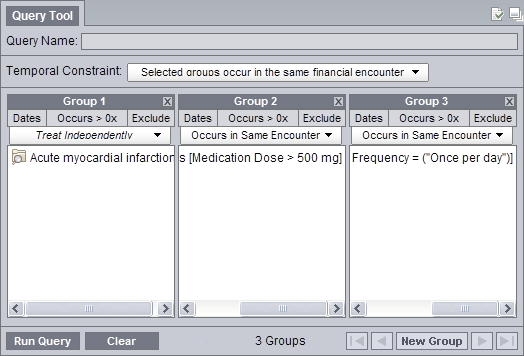
RESULTS: there are 4 patients who have had a medication with a dose greater than 500 mg and a frequency of once a day entered as a fact in the observation_fact table, where the medication dose and frequency have the same encounter_num AND the diagnosis of acute MI, the medication dose and frequency all have the same patient_num
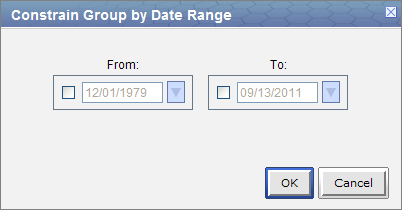
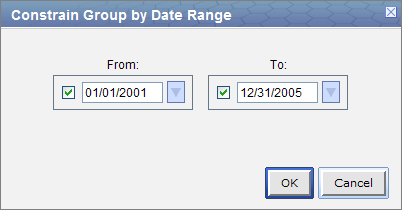
Users can define a date range to be used when querying the database. This date range can be in any one of the following combinations.
The start date associated with the observation is what is used to determine if there is a positive hit.
Only data with activity within the defined date range will be used.
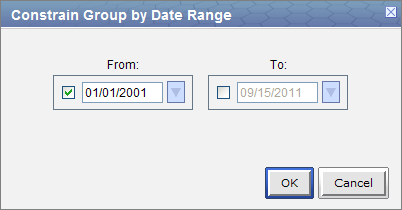
Example:
Concept: Acute Myocardial Infarction
From date: 01/01/2001
To date: 12/31/2005
In this example, if a patient has a diagnosis of Acute Myocardial Infarction (MI) entered on their record from 01/01/2001 to 12/31/2005 then their data will be included. If the patient does have an MI diagnosis but it was entered prior to 01/01/2001 or after 12/31/2005 then their information will not be included.
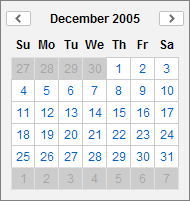
 ) to open the calendar view and click on the desired date.
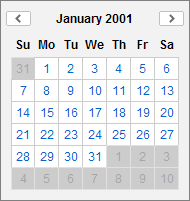
Once you click on the desired date the calendar window will close.
Data from the defined start date to the latest date available. No end date defined.
Example:
Concept: Acute Myocardial Infarction
From date: 01/01/2001
To date:
In this example, if a patient has a diagnosis of Acute Myocardial Infarction (MI) entered on their record any time on or after 01/01/2001 then their data will be included. If the diagnosis was entered prior to 01/01/2001 then it will not be included.
) to open the calendar view and click on the desired date.
Once you click on the desired date the calendar window will close.
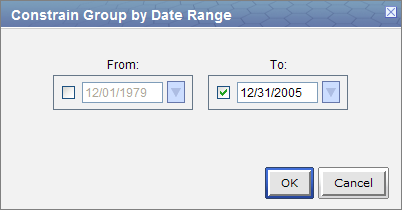
All data up until the defined end date. No start date defined.
Example:
Concept: Acute Myocardial Infarction
From date:
To date: 12/31/2005
In this example, if a patient has a diagnosis of Acute Myocardial Infarction (MI) entered on their record prior to and including 12/31/2005 then their data will be included. If the diagnosis was entered after 12/31/2005 then it will not be included.
) to open the calendar view and click on the desired date.
Once you click on the desired date the calendar window will close.
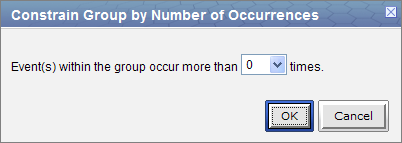
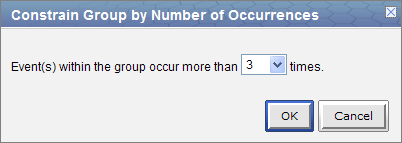
Users can define the number of times an item has to occur in order to be considered a positive "hit".
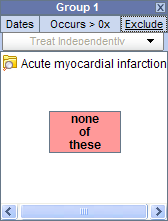
The exclude constraint will not include patients with the item(s) listed in the panel.
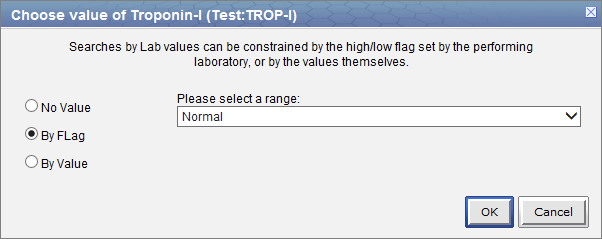
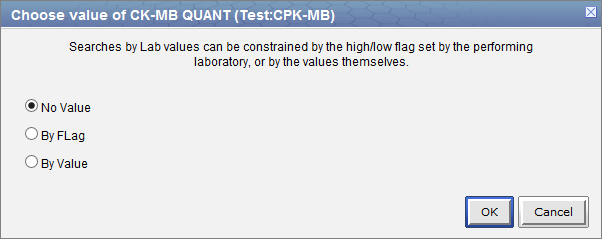
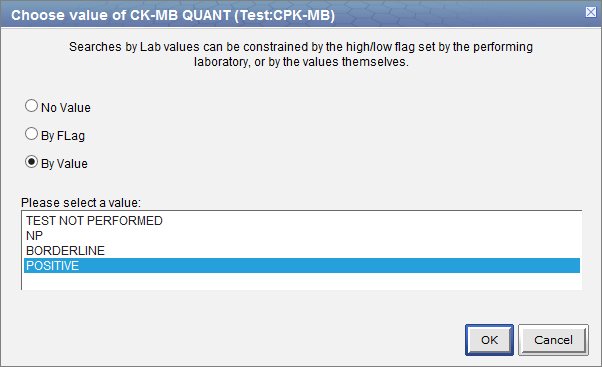
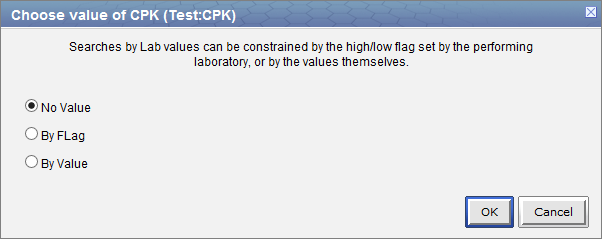
Value constraints can be associated with concept, but not all of them will have values. For instance, the diagnosis of Acute Myocardial Infarction does not have a value but the tests used to make the diagnosis do have values (high, low, numeric, etc.).
For those items that do have values there are different types of values that may be associated with it.
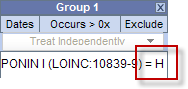
Flags are defined in the source system when the value is entered. The following are some examples:
|
NOTE: The value constraint window will open automatically when you drop a concept into a panel in the Query Tool view. This will only happen if the concept is set up in the database with XML metadata. The first three steps can be used if you did not add a value constraint when you added the item or if you wish to edit an existing item. |
|
TIP: To select more than one you can hold down the <Ctrl> key while clicking on each name. On the Macintosh you can hold down the command key instead of the <Ctrl> key. |
|
NOTE: The value constraint window will open automatically when you drop a concept into a panel in the Query Tool view. This will only happen if the concept is set up in the database with XML metadata. The first three steps can be used if you did not add a value constraint when you added the item or if you wish to edit an existing item. |
This section describes the process of running a query and the output.
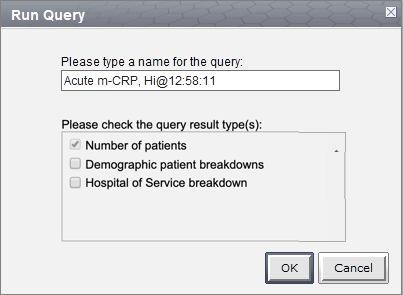
When you run a query you need to select what type of result the server will return. There are several result types available, each of which will yield a different output.
| Number of patients | Provides the total number of patients who met the search criteria. | ||||||||
| Demographic patient breakdowns | Provides the following breakdown of the patients by demographic attributes.
|
||||||||
| Hospital of Service breakdown | Provides a breakdown of the hospitals where the patients had their services. |
The result type(s) will appear when you click on the Run Query button and they can be selected in any combination.
This option will return a total count for those patients who meet the defined criteria and will display the appropriate information in the following views.
This option will return a breakdown by gender for those patients who meet the defined criteria and will display the appropriate information in the following views.
This option will return a breakdown by vital status for those patients who meet the defined criteria and will display the appropriate information in the following views.
This option will return a breakdown by race for those patients who meet the defined criteria and will display the appropriate information in the following views.
This option will return a breakdown by age for those patients who meet the defined criteria and will display the appropriate information in the following views.
This option will return a breakdown by the hospital of service for those patients who meet the defined criteria and will display the appropriate information in the following views.
Once the query criterion has been defined, the final steps are to click on the Run Query button, select the result type(s), and click on the OK button to run the query.

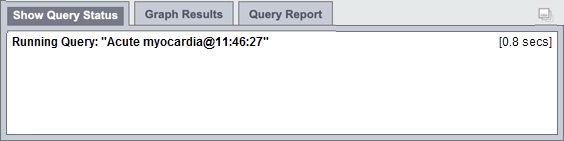
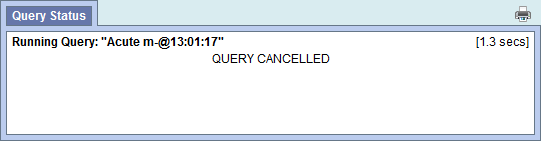
Once you begin the process of running the query the Query Status view will display "Running Query", the name of the query, and the time that has elapsed.
To cancel a query you simply click on the Cancel Query button.
|
NOTE: Keep in mind "Cancel Query" and the associated action will only appear when the query is still in the process of running |

This section describes the process of saving queries.
A previous query () is created automatically when a query is run from the Query Tool. The query is stored in the database and displayed in the Previous Query view.
|
NOTE: Previous queries can also be seen in Workplace view if the user copied it to their workplace or shared folder in workplace view. |
|
NOTE: If the previous query does not appear in the list automatically you can refresh the view to update the list. This is done by using the right mouse button and clicking anywhere in the Previous Query view. |
|
NOTE:
Previous queries can also be seen in Workplace view if the user copied it to their workplace or shared folder in workplace view.
|
At the successful completion of a query run, the detailed results are displayed as
The Query Status is available in the Query Status view, which is located below the Query Tool view and contains information regarding the status of a query that is either running or has just finished, as well as the results of a previous query.
To expand the "Query Status panel" for any of the three tabs, click on the square widget in the upper right corner of the panel.
There are three tabs in that panel: 'Show Query Status', 'Graph Results', and 'Query Report'.
The Query Status is displayed within the 'Show Query Status' tab of that panel.
While a query is running, the name of the query and how long it has been running will appear in the 'Show Query Status' tab.
Other information that may be displayed in this tab depends on which options have been selected in the 'Run Query' popup box when the query was run.
Once the query has finished, the number of patients and other data meeting the search criteria, as well as the time it took to retrieve the requested information, will be displayed.
|
NOTE: The result types that appear will depend on what you have selected when running the query.. |
The Query Graphs are available in the Graph Results view, which is located in the same panel as the Show Query Status view; i. e., below the Query Tool view. It can be displayed when the 'Graph Results' tab is selected. It contains graphical presentations of the results of a finished query.
Indeed, when a query completes, or when a previous query is rendered, the "Query Status panel" display will be automatically switched to the that of the 'Graph Results' tab presentation.
Again, there are three tabs in this panel: 'Show Query Status', 'Graph Results', and 'Query Report'.
To expand the "Query Status panel" for any of the three tabs, click on the square widget in the upper right corner of the panel.
The contents displayed depend on what options are selected in the 'Run Query' popup box when the query is run.
If any of the demographics breakdown (Age, Race, Gender, Vital Status) and hospital breakdown categories is selected in the 'Run Query' popup, corresponding charts will be display accordingly.
Following is an example of query not ran with any breakdown selected:
Following is an example of the same query ran with 'Hospital of Service Breakdown' selected only:
Following is an example of the same query ran with 'Patient Demographics Breakdown' selected only:
Following is an example of the same query ran with all breakdowns selected:
|
NOTE: The result types that appear will depend on what you have selected when running the query.
When the resulting collection of patients is large, and breakdown data are involved, sometimes data for one of the charts may lag behind a bit.
In such cases, simple click the |
The Query Report is displayed in the Query Report view, which is located in the same panel as the Show Query Status view; i. e., below the Query Tool view. It can be displayed when the 'Query Report' tab is selected. It contains tabulational and graphical presentations of the results of a finished query.
Again, there are three tabs in this panel: 'Show Query Status', 'Graph Results', and 'Query Report'.
To expand the "Query Status panel" for any of the three tabs, click on the square widget in the upper right corner of the panel.
The contents displayed depend on what options are selected in the 'Run Query' popup box when the query is run.
If any of the demographics breakdown (Age, Race, Gender, Vital Status) and hospital breakdown categories is selected in the 'Run Query' popup, corresponding charts will be display accordingly.
Following is an example of a query report for a query ran with all breakdown selected:
Following is an example of the resulting browser-based print dialog (using the 'Chrome' browser) when one of the 2 'Print' icons (located at the left top and bottom corners, respectively) of the query report is clicked:
|
NOTE: There is no 'Print' icon provided in the 'Graph Report' when using the 'Internet Explorer' browser, due to issues associated with that browser type. The 'Print' icons are only present in the 'Graph Report' when using the 'Firefox' or 'Chrome' browser types. |
Users are able to print out the query information if they wish to have a hard copy of the search criteria defined for a query.
When printing a query you can either print the information for a current query or you can drag a previous query to the query tool view and print the information associated with that query.
The following steps outline the process of printing a query once you have the appropriate query in the Query Tool.
Information in the Workplace view is related to the most common concepts and queries that an individual uses and in essence becomes their personal workspace. The main objectives of this view are:
The items stored in the Workplace view can be used in many of the other views, such as the Query Tool view.
This section describes the layout and contents of this view.
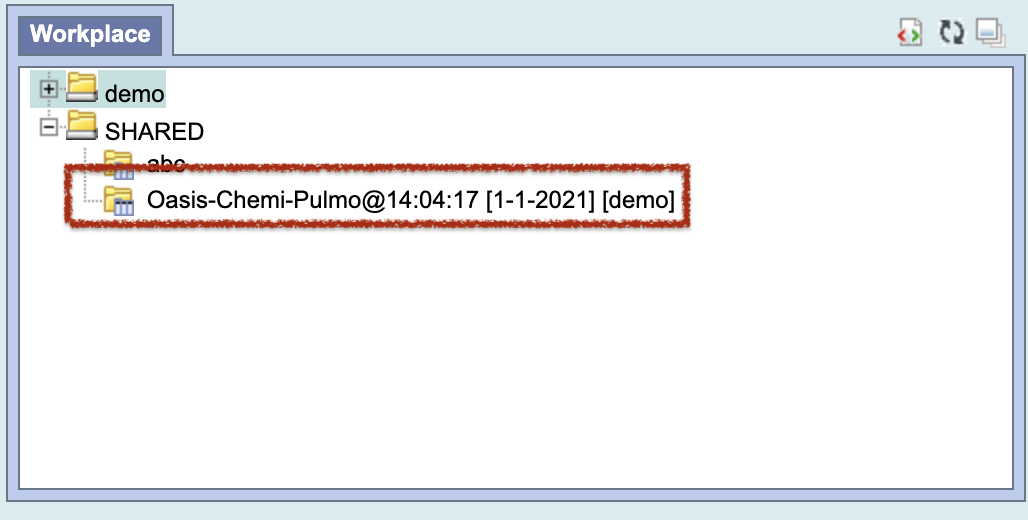
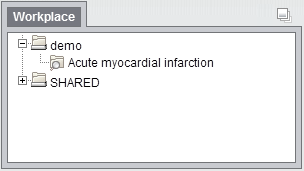
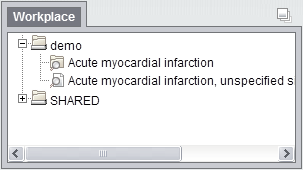
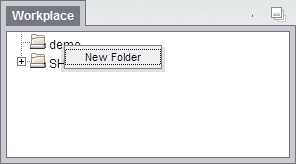
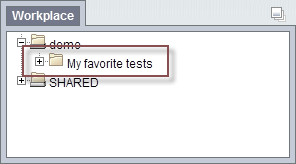
As stated above the Workplace view is a place for users to store and organize those items they use on a regular basis. It is also a way to share these items with other users by placing them in the SHARED folder.
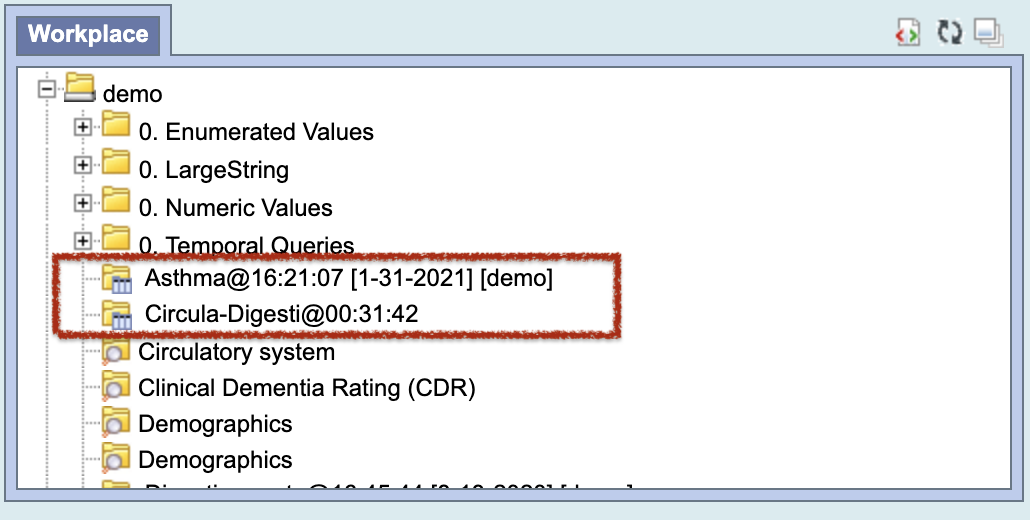
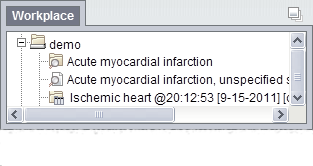
The Workplace view is hierarchical display of the items added by the user. There are three main branches or components of the tree that displays.
The highest level is the individual user folder ( ). This folder is automatically created with the user's name and it is used to store items added by the individual user. This level cannot be used when creating a query.
|
NOTE: This also includes the shared folder. |
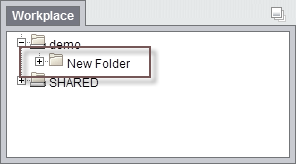
A folder ( ) in the workplace view contains other folders and / or items added by the user. It can be expanded and collapsed by clicking on the plus sign () or negative sign () next to it. A user defined folder can not be dragged to other views. It can be moved around within the Workplace view.
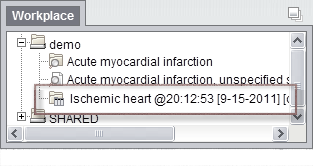
Items are the lowest level of the hierarchy. They can not be expanded further. Some examples of items are listed below.
)
)
Users can expand or collapse a folder by clicking on the plus sign () or negative sign () next to the folder icon.
) next to the folder in the Workplace view.
) next to the folder in the Workplace view.
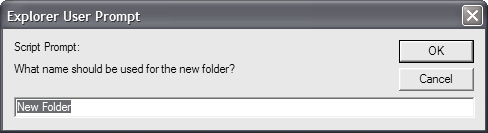
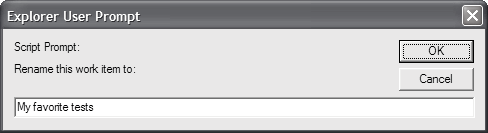
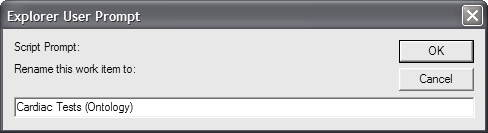
Users can easily rename an existing folder.


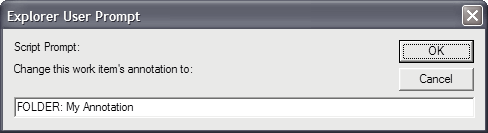
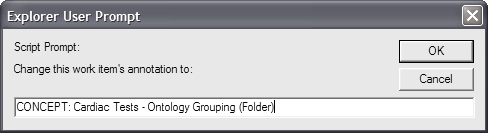
Users can change the default annotation for any of their folders in the Workplace view.
|
NOTE: The annotation is what is displayed in the tool tip. |

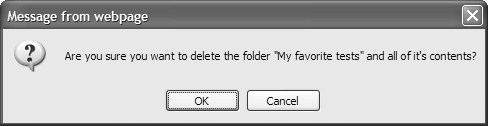
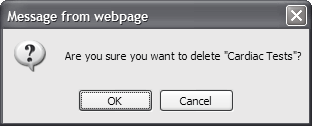
Users can remove a folder from the Workplace view.
|
WARNING: All items in the folder will be deleted when the folder is removed. It is recommended that you move those items you want to keep to another folder. |

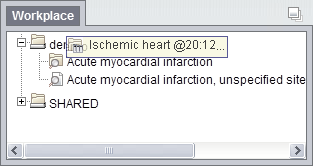
Users can easily rename an item in the Workplace view.


Users can change the default annotation for any of the items in their Workplace folder.
|
NOTE: The annotation is what is displayed in the tool tip. |

Users can remove items from the Workplace view.

This section describes how to add items to the Workplace view.
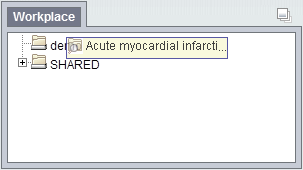
Items can be dragged and dropped (copied) into the Workplace view from other views in the Web Client.
A folder () and all its concepts (children) can be added to Workplace by dragging the folder name from one of the following views.
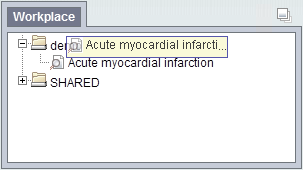
A concept () can be added to Workplace by dragging the name of the concept from one of the following views.
A previous query () can be added to Workplace by dragging the name of the previous query from the following view.
The Find Terms view provides a way to search for a particular concept.
|
NOTE: For detailed information on how to search for terms, please see the Find Terms help. |
) or concept () by clicking on its name.
The Navigate Terms view contains a hierarchical display of all the concepts that can be used to search the database.
|
NOTE: How the items are grouped and displayed is dependent on how the database is setup. |
) or concept () by clicking on its name.
The Previous Query view displays the queries that were run by the user. Each previous query contains a set of results; within these results are the result options that were selected when the query was originally run. The result options include Patient set, Encounter set, Number of patients as well as various other patient breakdowns
) by clicking on the name of the query.
This section describes how to use items in the Workplace view.
Items can be dragged and dropped (copied) from the Workplace view to other views in the Web client.
An ontology folder () and all its concepts (children) can be added to other views by dragging the folder name from Workplace to one of the following views.
|
NOTE: User folders can not be dragged from the Workplace view. |
A concept () can be added to other views by dragging the name of the concept from Workplace to one of the following views.
A previous query () can be added to other views by dragging the previous query name from Workplace to one of the following views.
A folder or individual concept can be added to the query tool view by simply dragging the item from Workplace view and dropping it into one of the panels in the Query Tool view.
) by clicking on the name of the folder.
) by clicking on the name of the folder.
A previous query can be used to run a new query or as an item within a query (query-in-query). To add a previous query to the Query Tool view simply drag the query name from the Workplace view.
Within the Query Tool view, the previous query can be added to one of the following two locations.
| Query Name field | The items and constraints from the original query will be used to create a new query. This information can be edited to make a new query or can be used as is to run the query again. |
| Panel (Group) | Used within a new query (query-in-query). The information associated with the previous query can not be edited. Add additional search criteria (items) to be used in the new query. |
|
NOTE: The process of adding a previous query to the Query Tool view is the same for both standard queries ( |
/ ) by clicking on the name of the query.
|
NOTE: When you run the query it will receive a new name. This is to distinguish the first previous query from the second. |
/ ) by clicking on the name of the query.